Plot the outputs
[Section in process…]
SimpleMC has the following alternatives to generate figures from the MCMC outputs:
In the ini file you can set the option to plot the outputs as follows:
[custom]
...
model = LCDM
datasets = SN
analyzer = mcmc
; You can select only one of the following three options
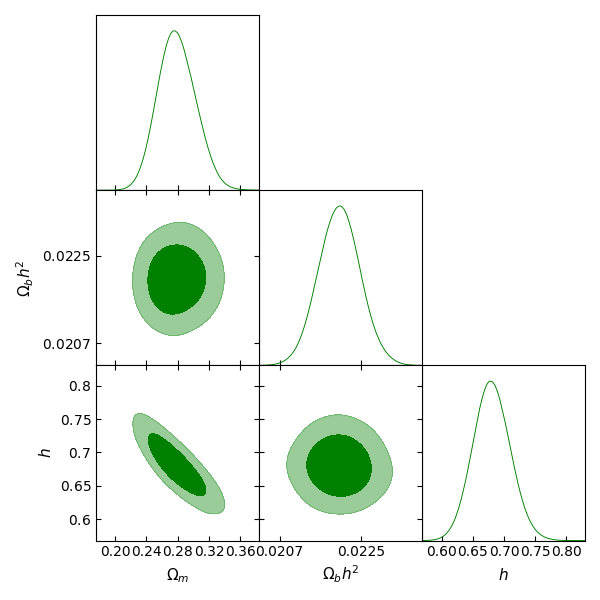
getdist = True
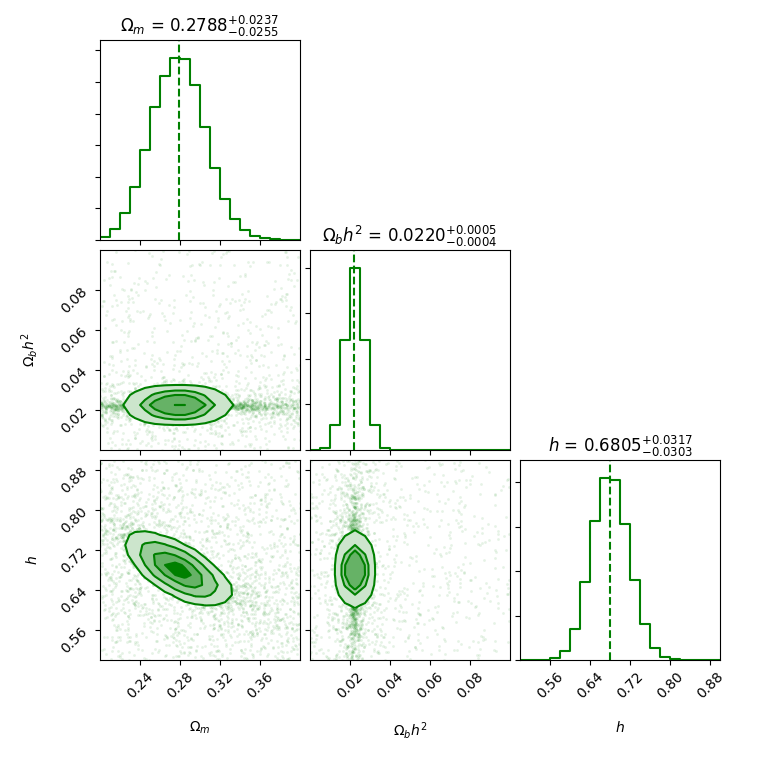
corner = True
simpleplot = True
;True if you want to display and save the figure
;False if only want to save the figure in your chainsdir
showfig = True
...
With getdist:
With Corner:
With Simple_Plot class
The Simple_Plots class reads the chains to draw with the chosen option.
